Project Overview
iCharts is a Business Intelligence tool for NetSuite and Google Cloud. My objective was to create a powerful tool that beautifully visualizes and analyzes user data. I contributed to the company's success by redesigning the end-to-end user flow, developing new product features, and enhancing product interaction and UI design.
My Role: Lead UX Designer
Timeline: 4 months
Cross-functional Teams: VP of Product, Engineering
Business Impact
Product Quality
Improve Overall User Experience
Resolving main user pain points by reinventing the end-to-end product experience and redesigning the design systems with optimized UI components and interactions.
Revenue Growth
The whole product reinvention not only increased the existing customer satisfaction but also helped secure a Million dollar contract with one of the customers.
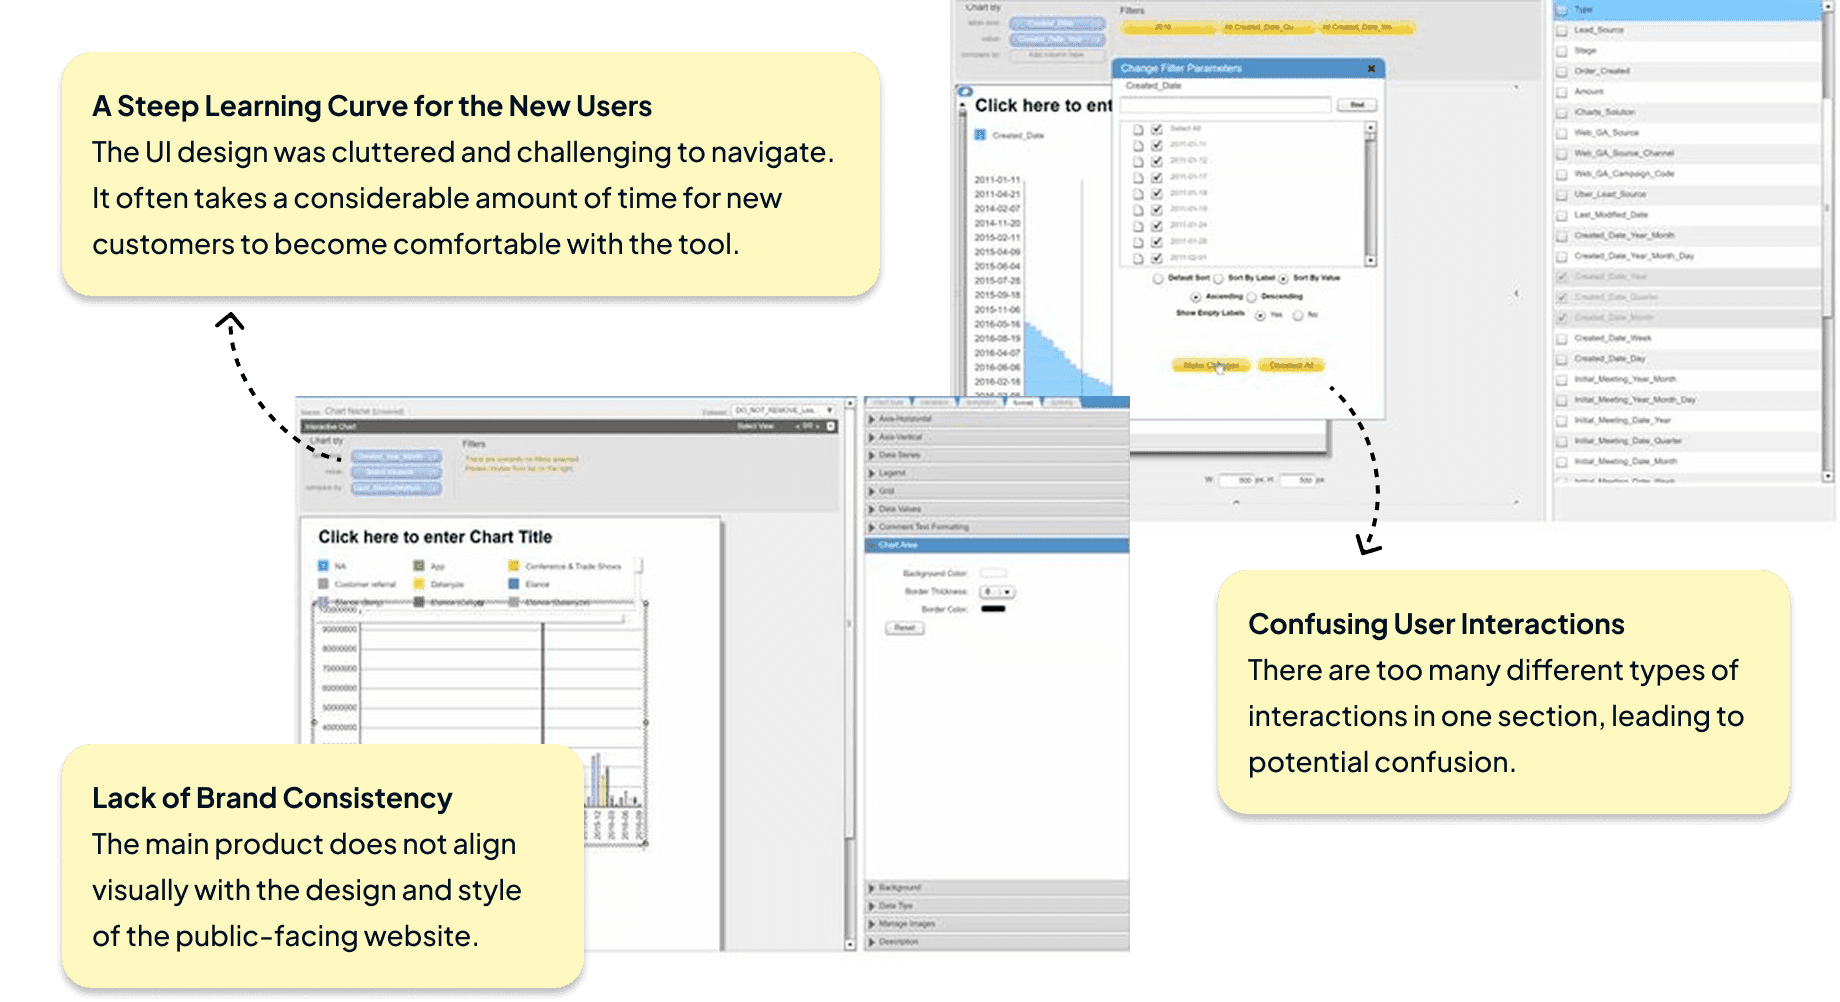
Identify Legacy Product Issues and User Problems
The product had an outdated UI and it didn’t have the same design system as their marketing website. The inconsistent user interaction also caused user confusion which made the product hard to use. It creates steep learning curve especially for their first time users.
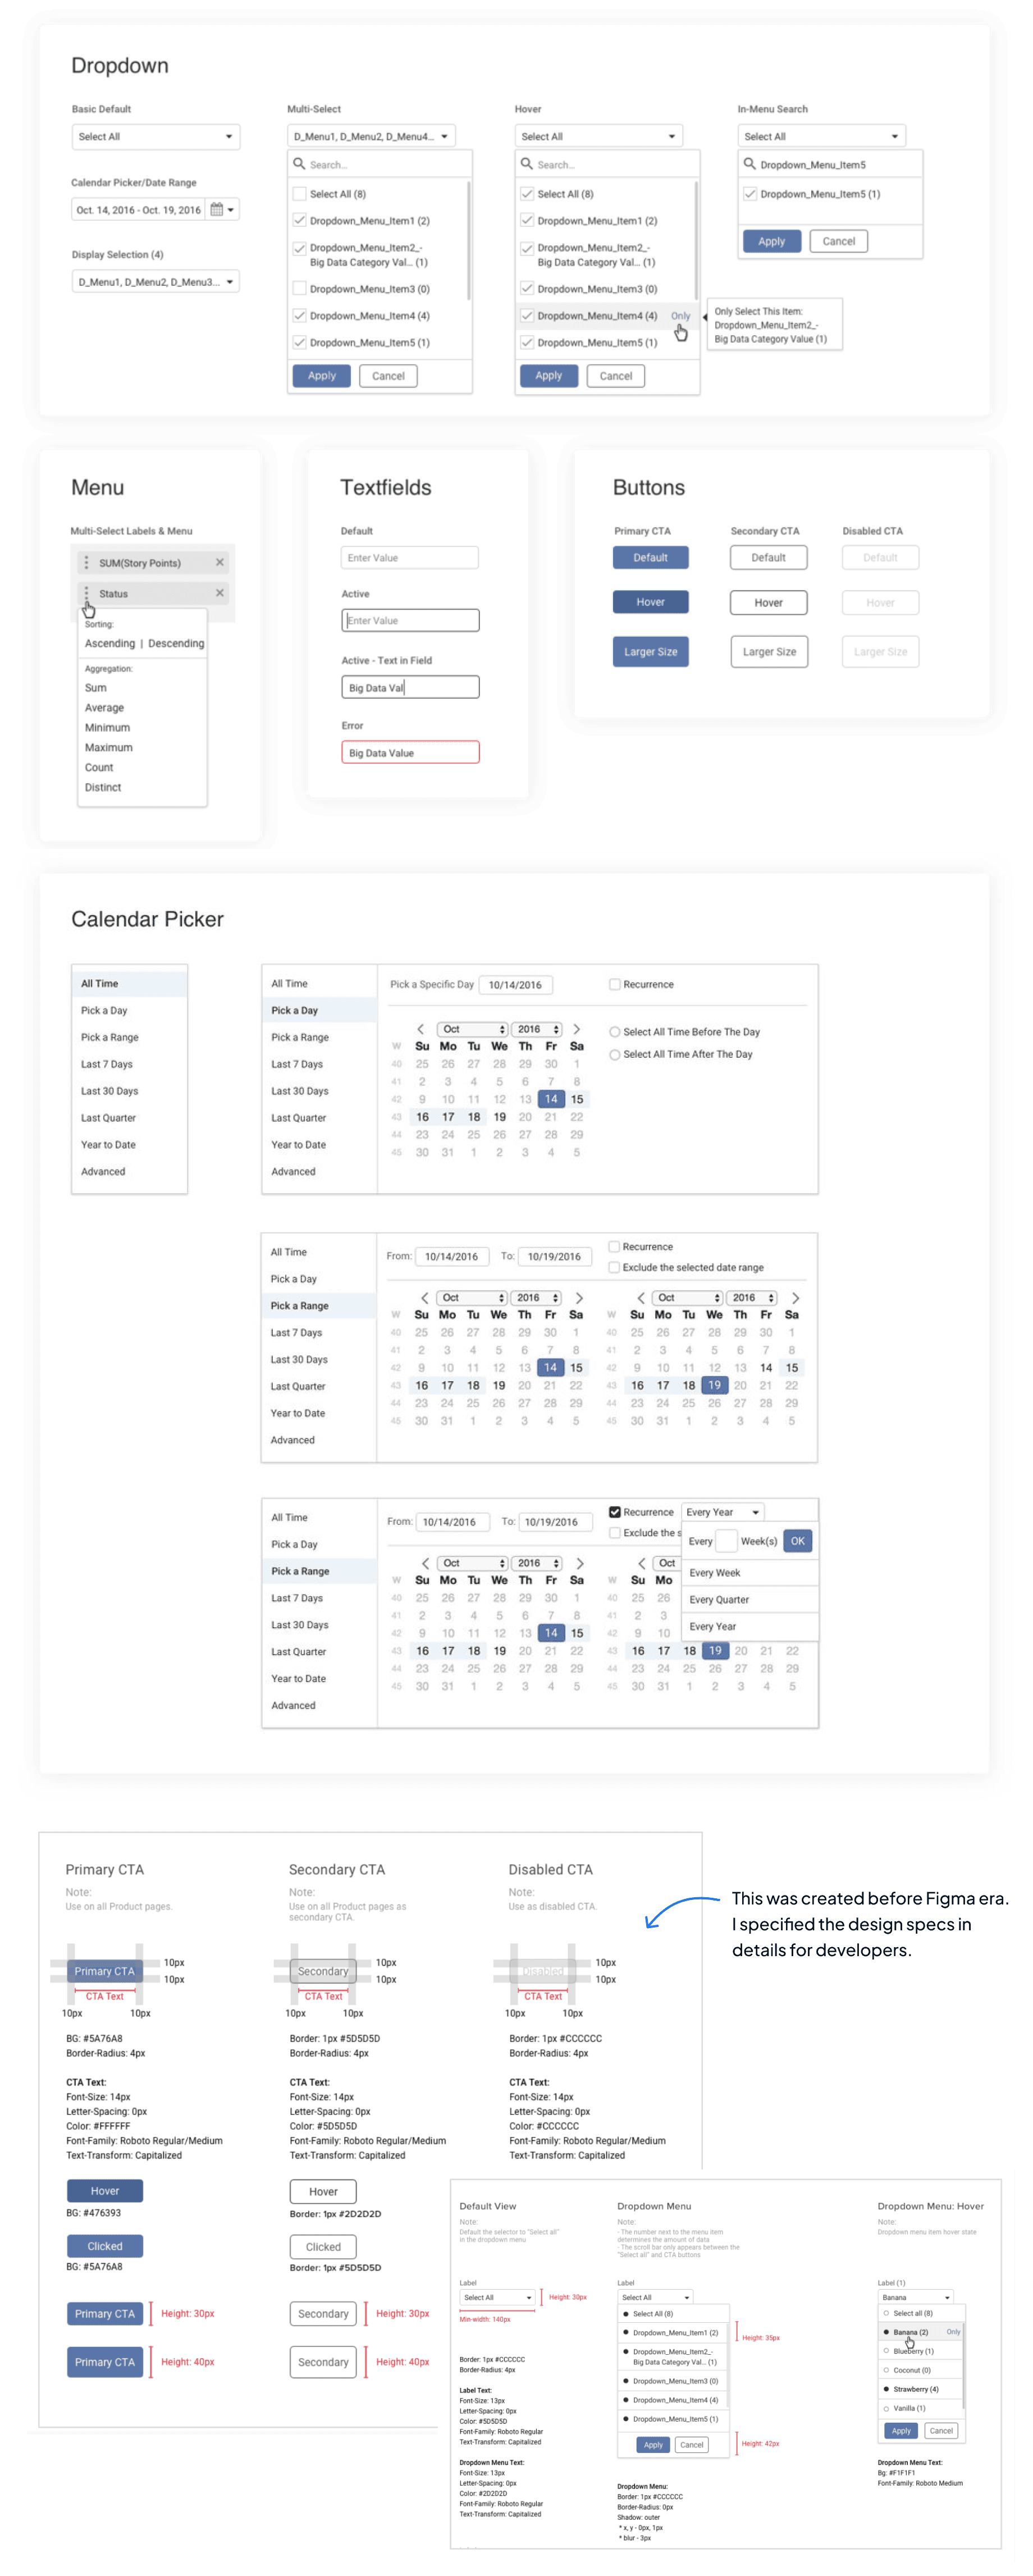
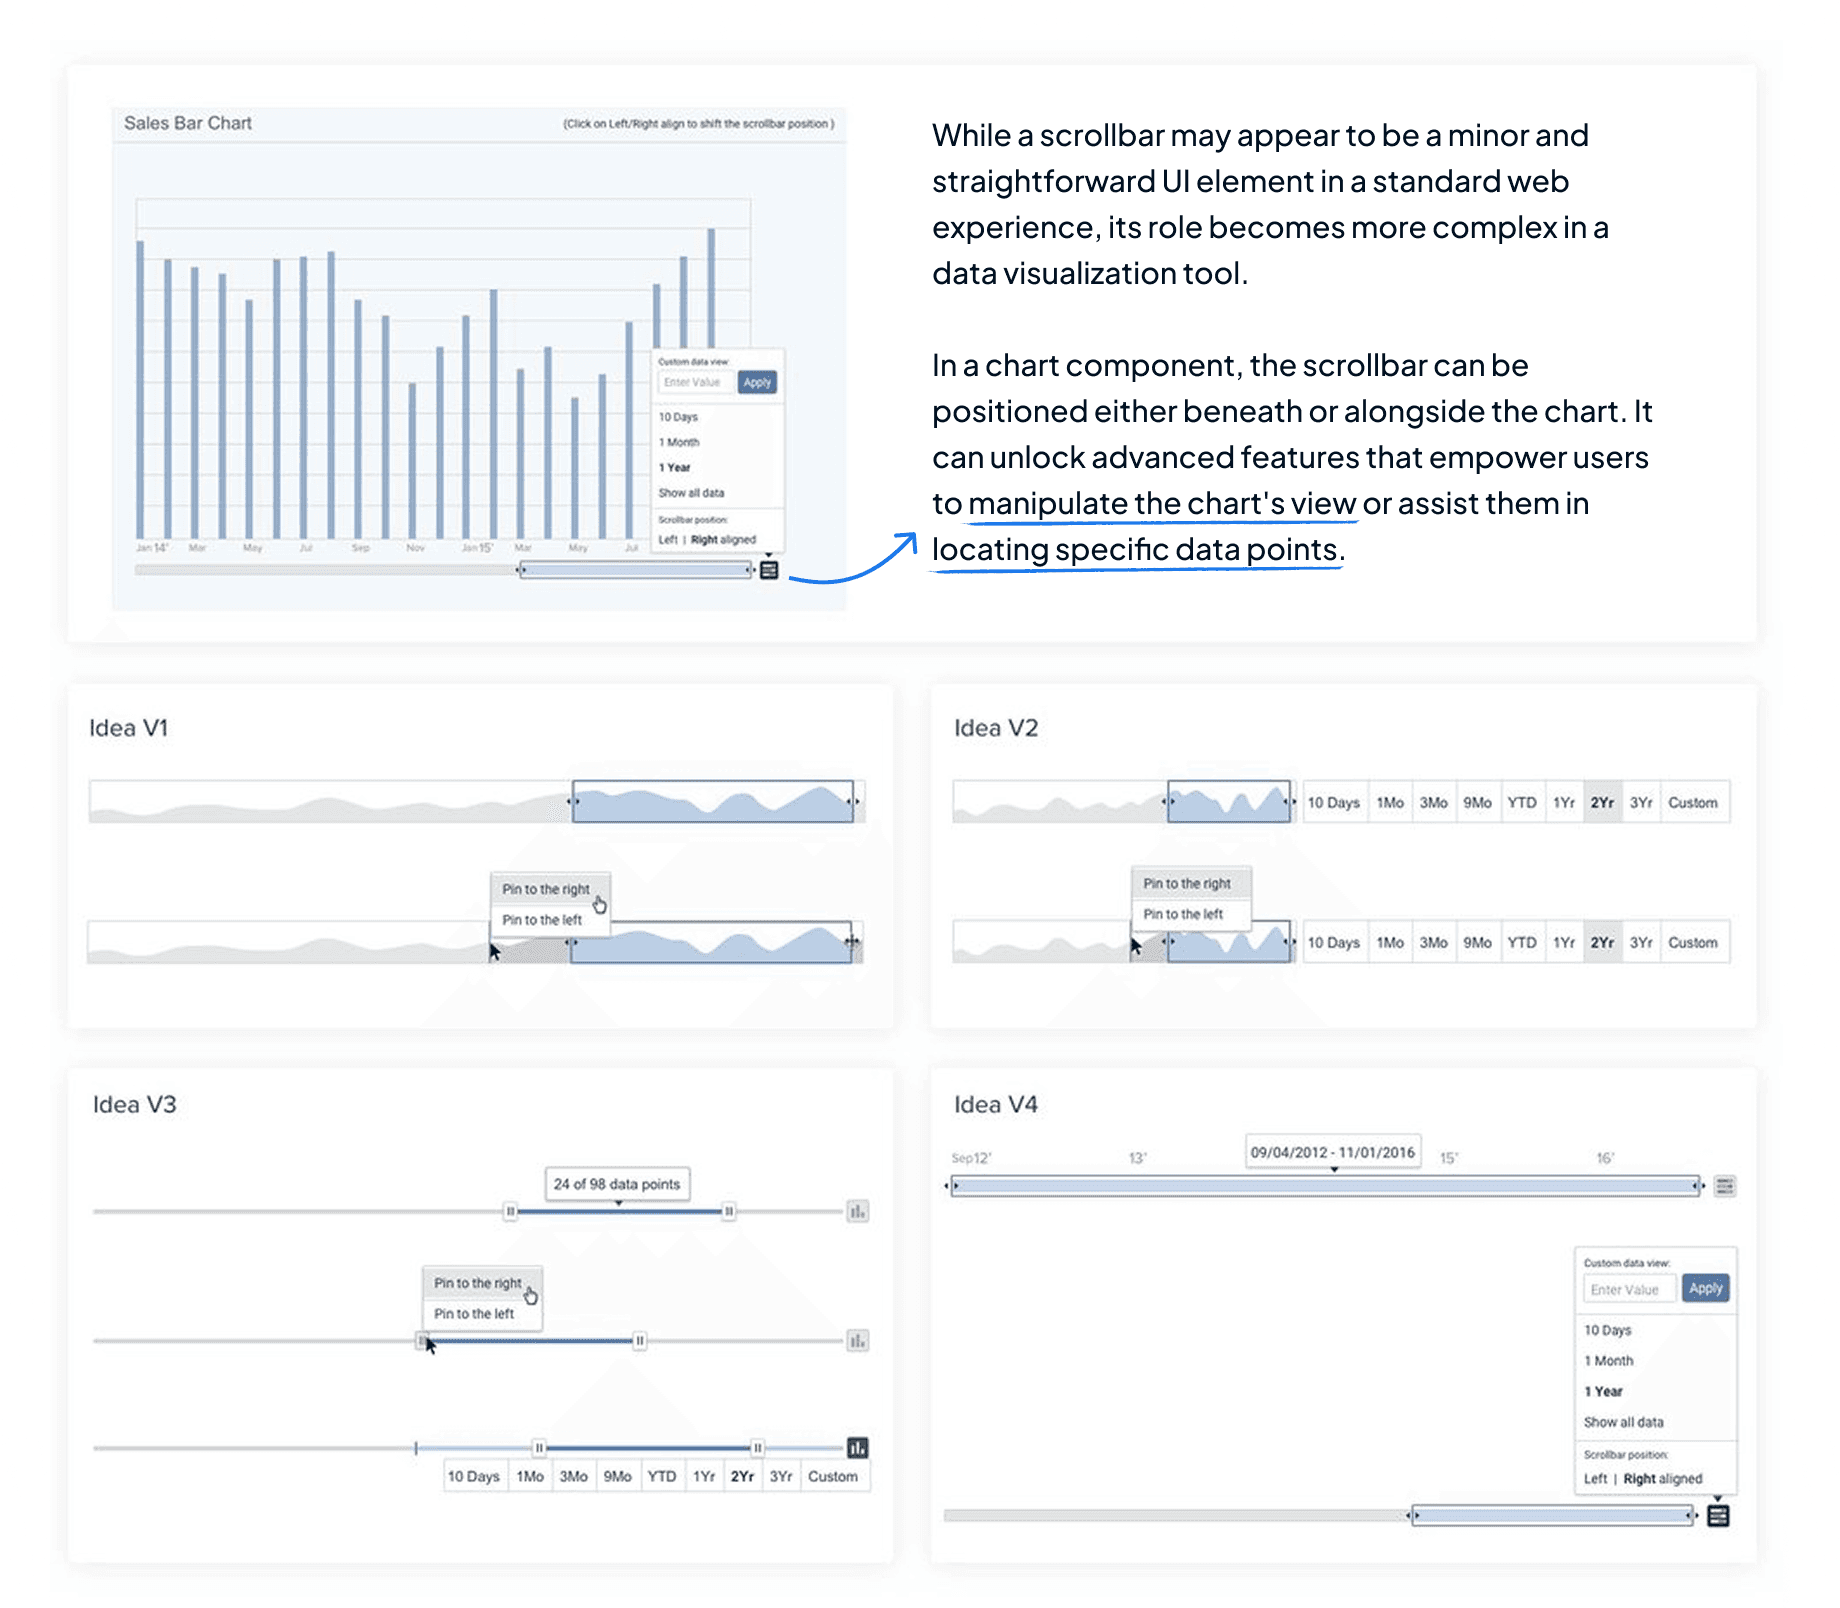
Start with Building Blocks: Fundamental UI Component Design Iteration
In the beginning of iCharts product redesign, I started with tactical tasks while learning more about the product itself. Scrollbar is one of the UI elements I worked on. It includes advanced functionalities for customers to change a chart’s view. I did some research on the design patterns and came up with a few ideas to be discussed with PMs and engineers.
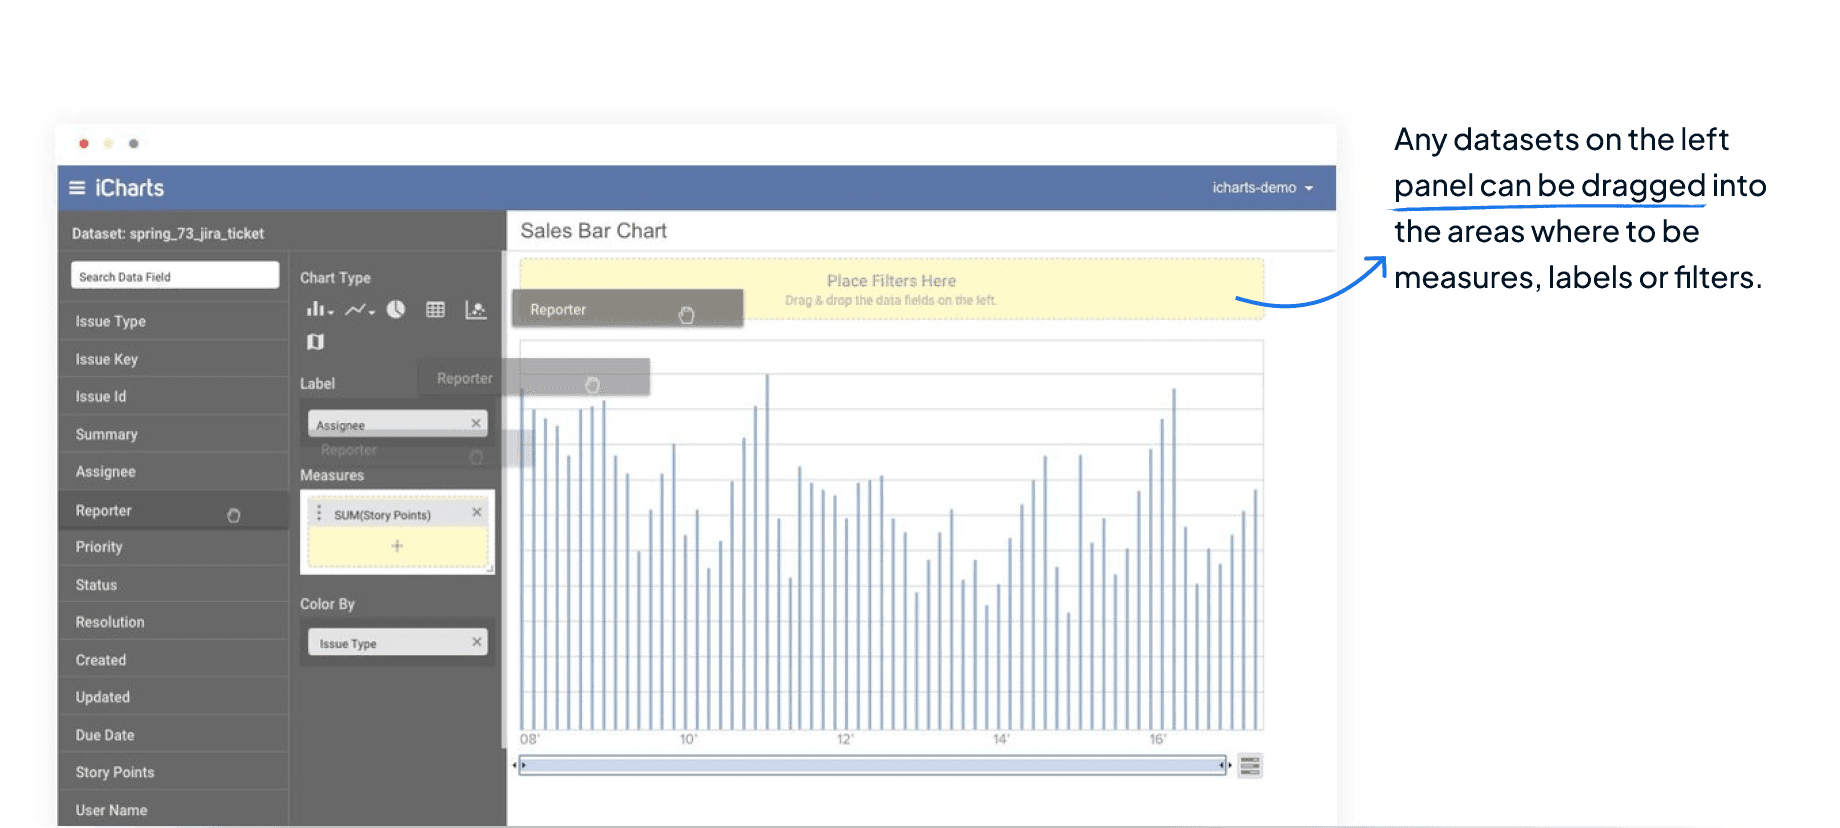
Initial Product Concept - Drag and Drop Datasets to Make Customized Charts & Dashboards
An initial concept of how we wanted the core product interaction to be - as simple as drag-and-drop interaction with individual datasets. Any datasets on the left panel can be dragged into the areas where to be measures, labels or filters.
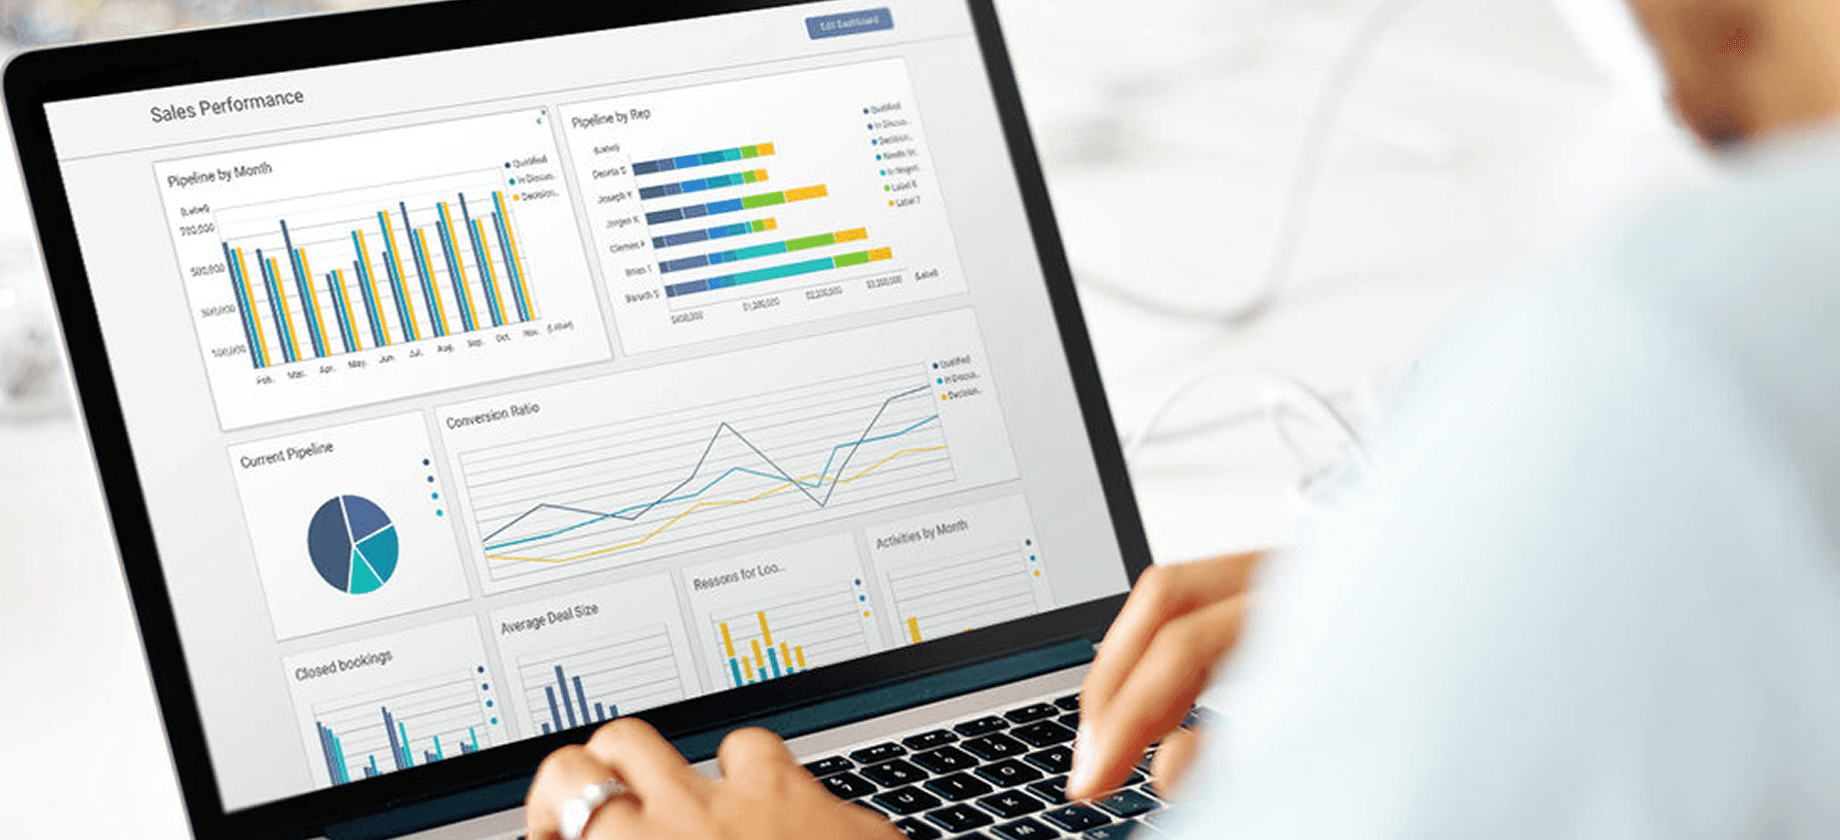
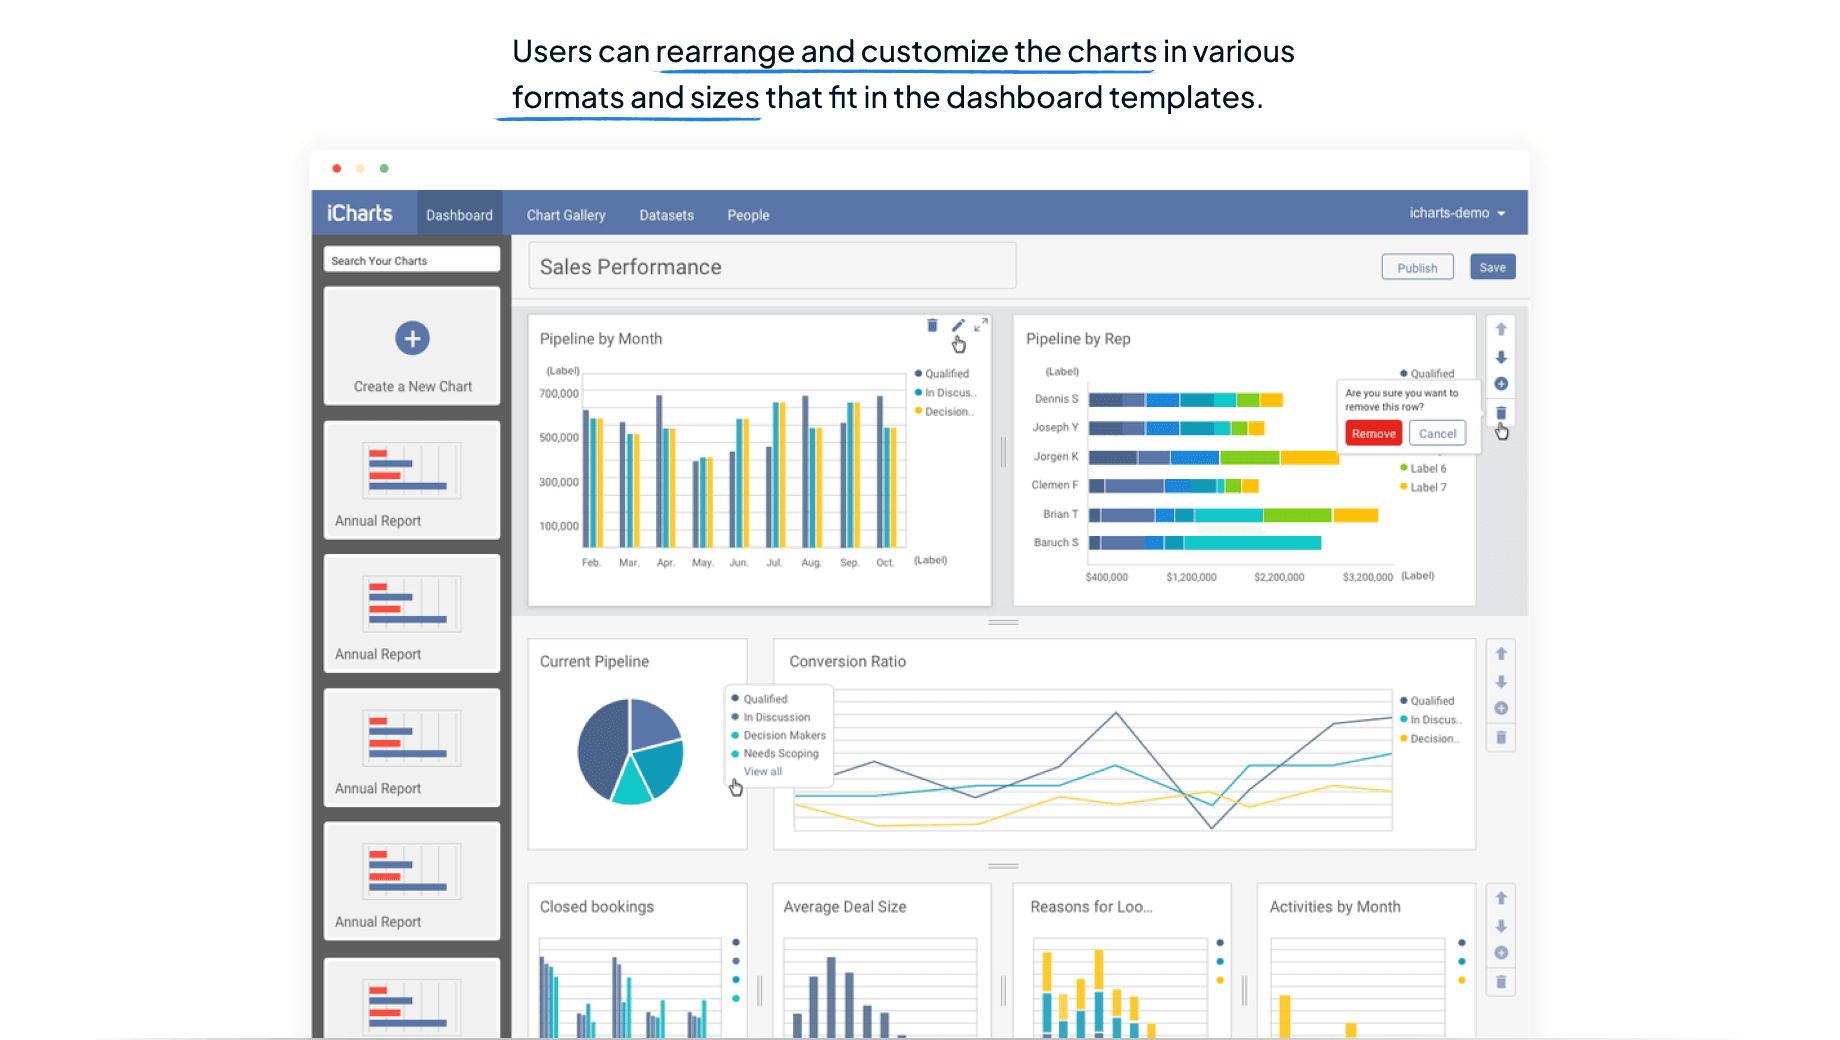
MVP for the New Product Dashboard
I created the new concept of dashboard where users could manage and combine multiple charts in one view by bringing all the redesigned UI components together.
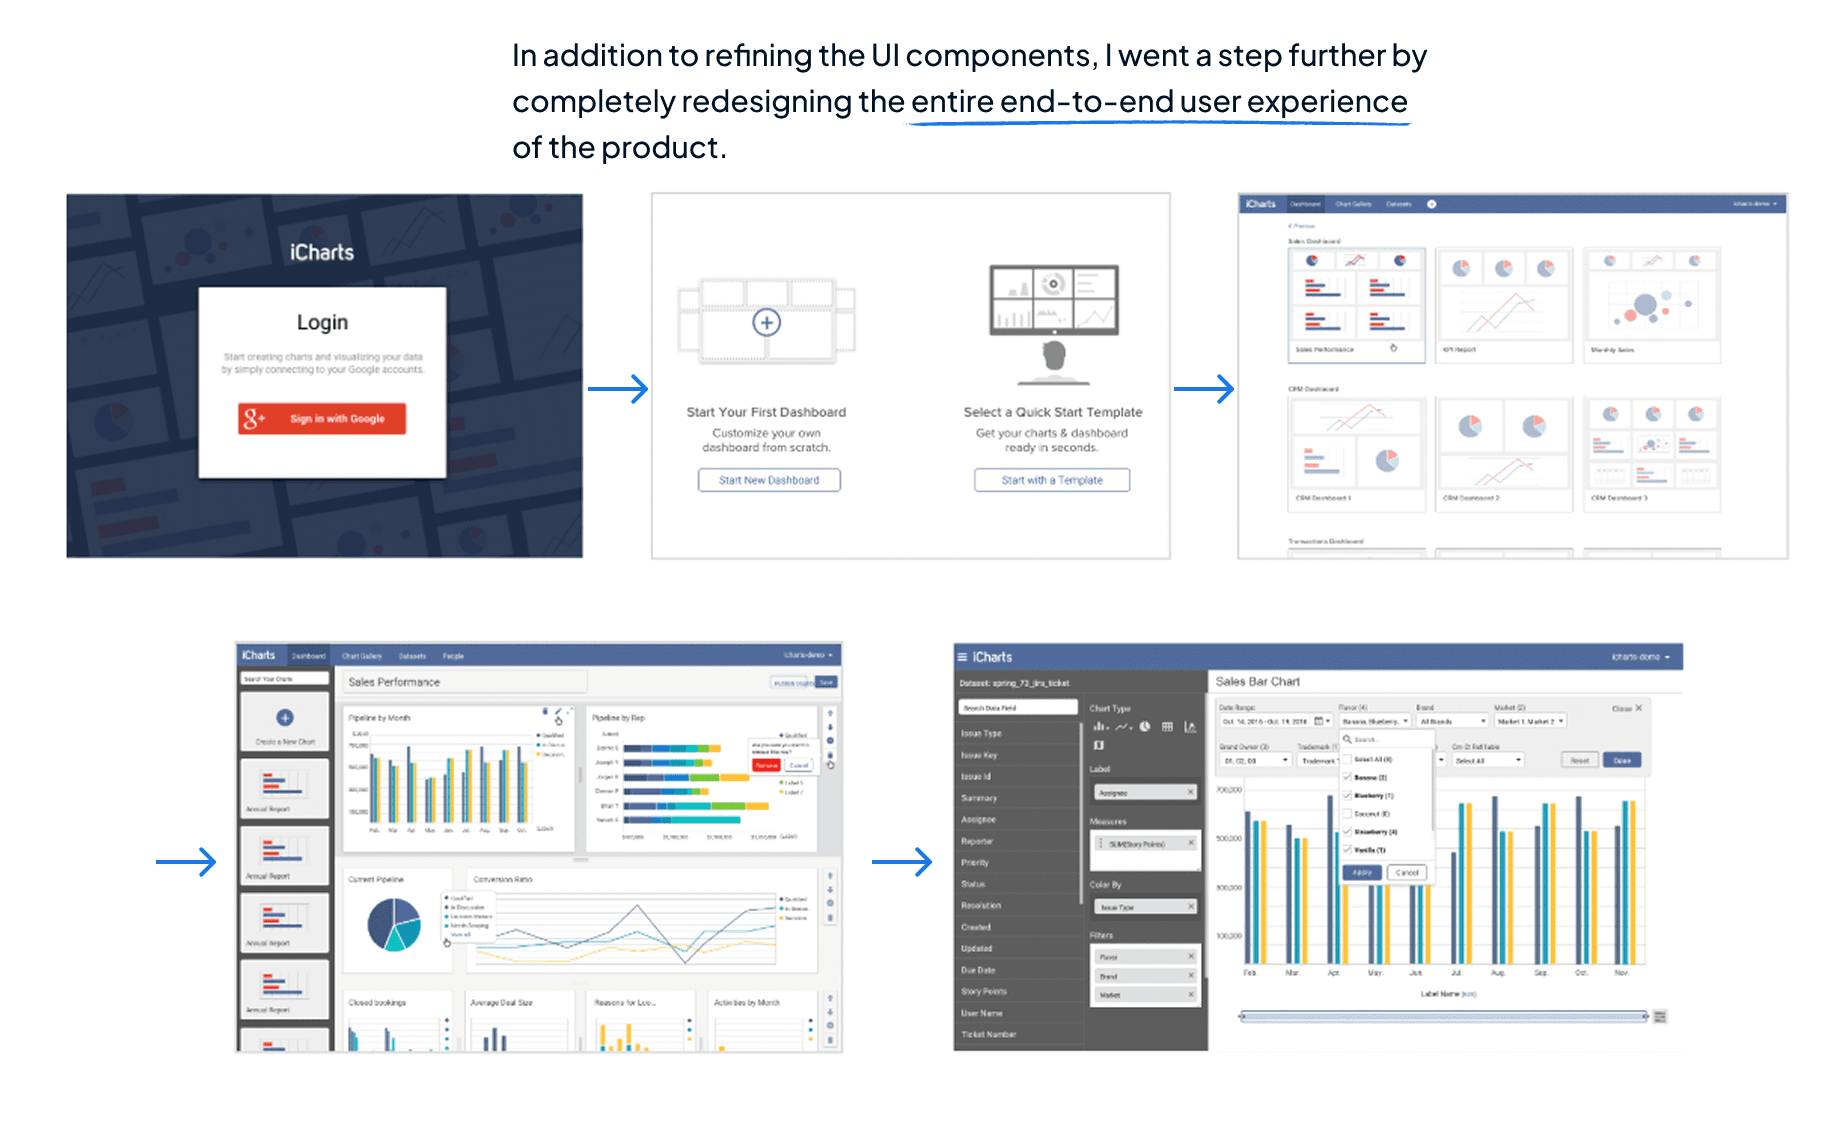
End-to-end Product Flow Redesign
Redesign the end to end user experience, from account creation to customizing dashboards and charts.
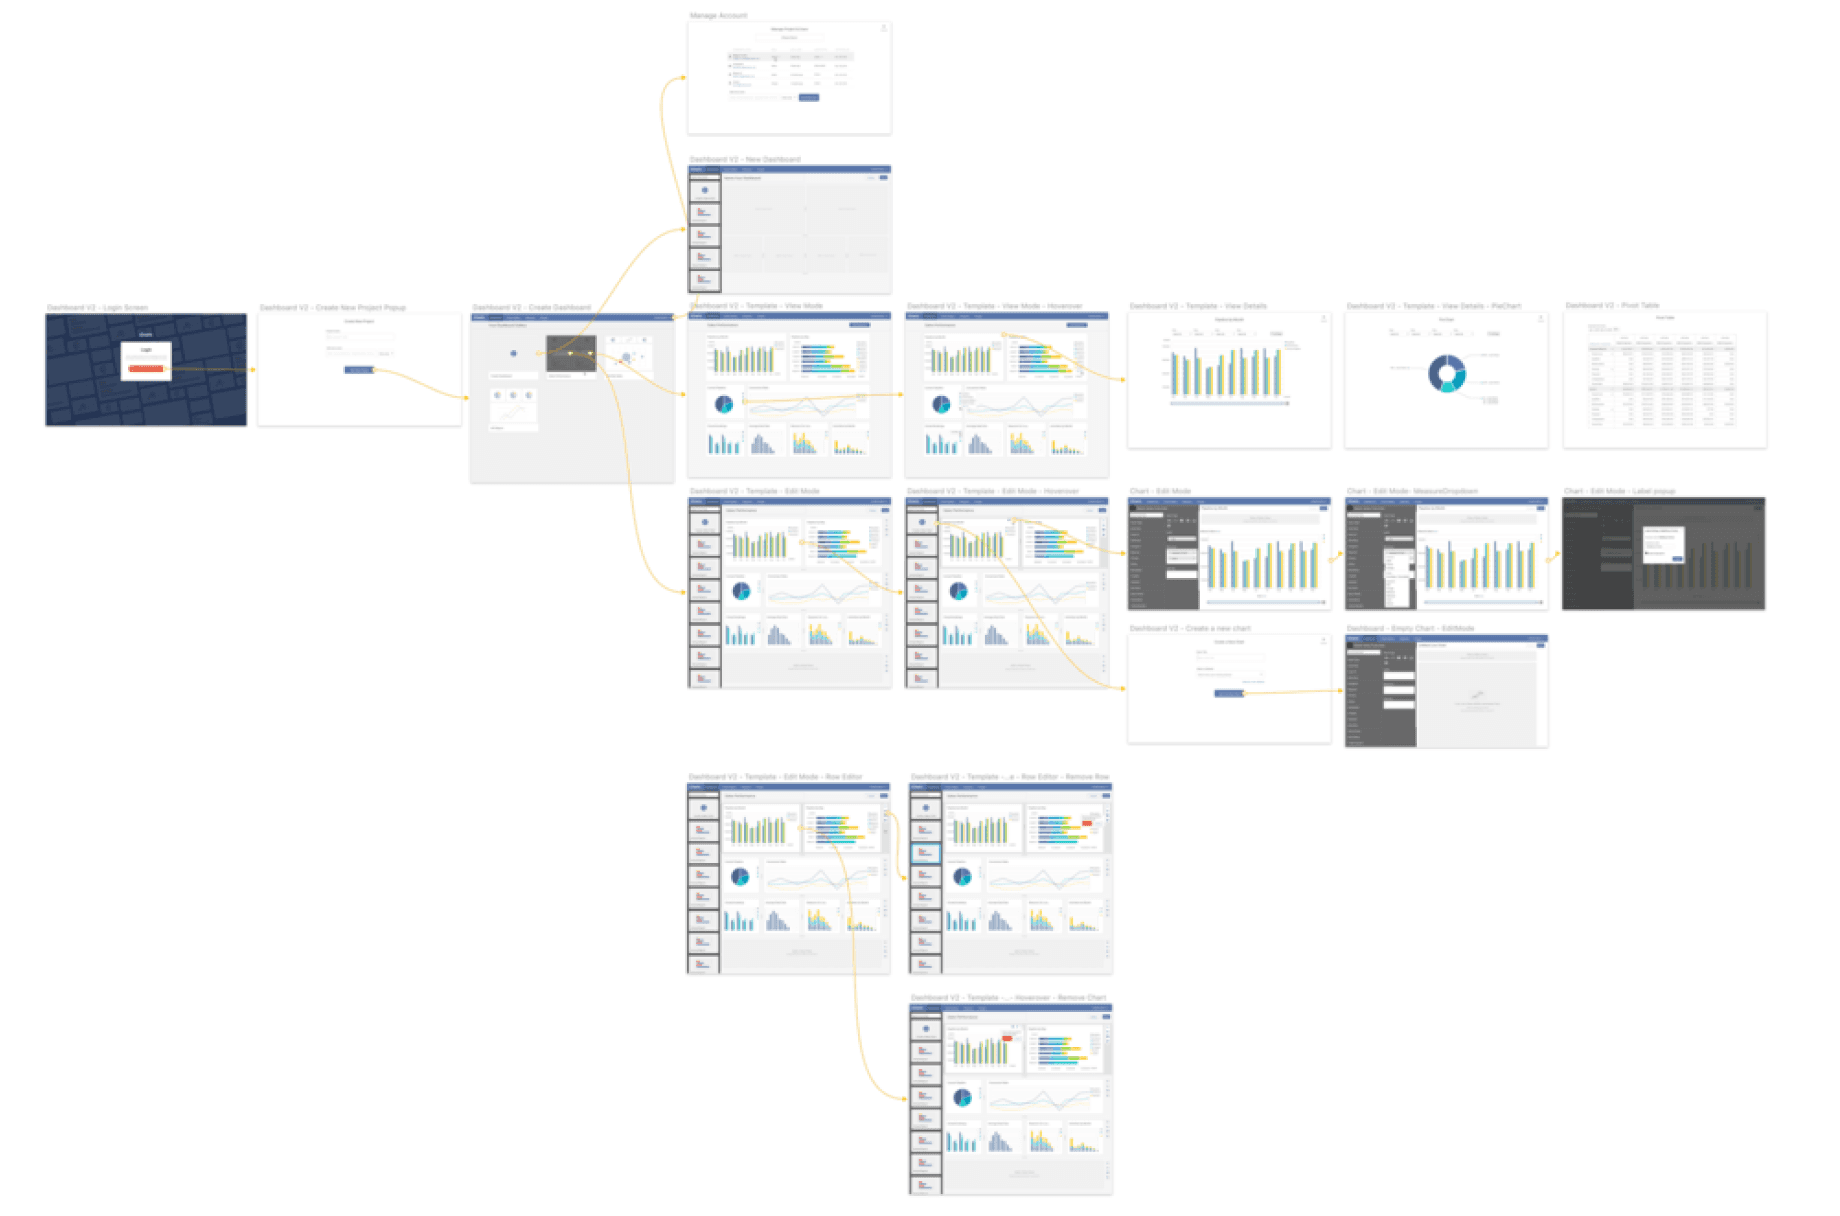
Zoom out to See the Product Workflow in a Big Picture
Looking at the whole product in a bigger picture, I mapped out the end to end flow with different scenarios in details.